Today we are going to explain how to make a basic graph with Excel, the office application for Microsoft spreadsheets. With this tool, you can create tables to represent various types of data, and then you can use these tables to create a graph from them.
If you are starting with this tool and want to learn the basics to make these tables, then we will guide you so that you can do the first one. It is not going to be particularly complex, but it is a good base from which to start improving little by little.
How to Make a Graph in Excel: Create a chart in Excel
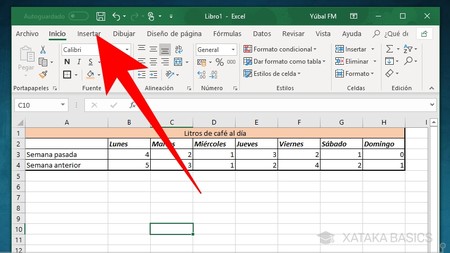
The first thing you have to do is prepare in Excel the data from which you will later want to make your graph. Once you have them, click on the Insert option that you have in the toolbar to access the options in which you can choose different elements to enter in your table.
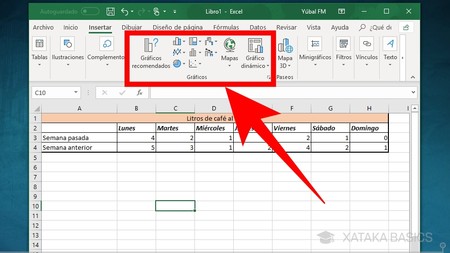
In the Insert section, you will see a category called Charts, in which you will find different types of charts that you can add to your table. The first step, therefore, is to think about the type of graph you are going to want to use.
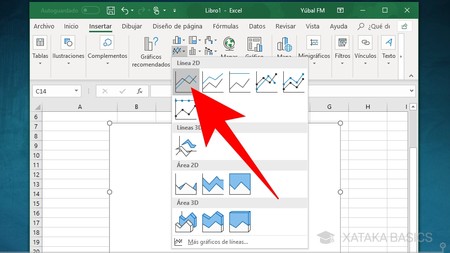
Once you decide on a type of graph, click on its icon and choose the one that most convinces you among the various options that you will find in each type. And don’t worry because you will be able to change the type of graph whenever you want.
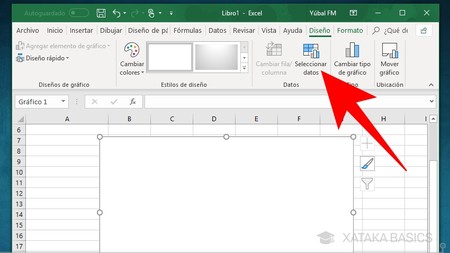
When you click on a chart type, a large box will appear within your Excel. The box will initially be blank because you still have to enter the data. To do this, click on the Select Data button that will appear in the Design category of the toolbar, which will automatically open when you insert the box for the graph.
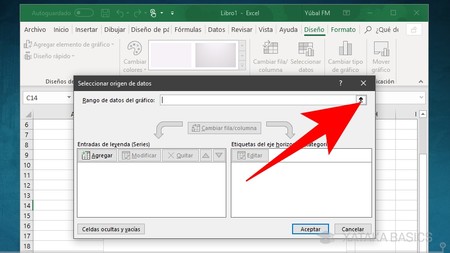
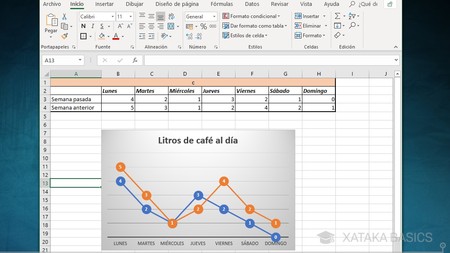
You will see a box called Select data source, in which you will be able to enter the data you want to show in the box. To start, you must click on the Data range of the graph, specifically on the up arrow that appears on its right.
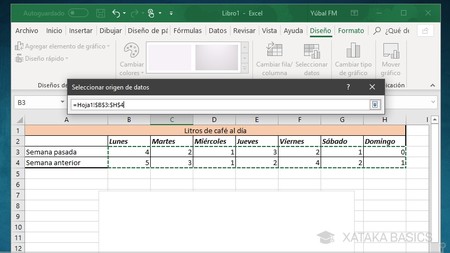
When you choose the Chart Range option for the chart, the menu will be minimized and you will return to your Excel sheet. In it, you must now select the data you want to use in the graph and press Enter to confirm the selection. When you select them you will see that they are inside a green rectangle and that in the code of the cells it will be automatically written in the Select data source box that you will have superimposed.
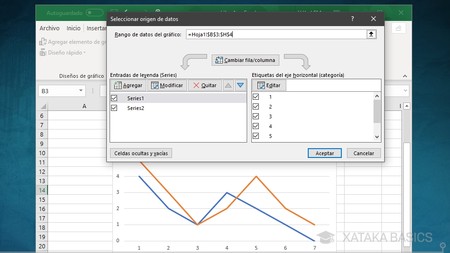
Once the data is selected, your graph will be automatically generated. Now, you will continue to have the Select data source box that will allow you to configure the legend as what appears on the horizontal axis of categories, where you can press Edit to select again in your Excel the words that you want to appear. You can also change the legend of the series or lines of the graph.
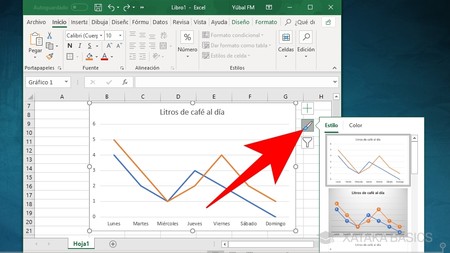
When you close the Select data source box you return to Excel, where you already have your box created. Even so, when you click on it, on the right side you will get other options to edit it, including a brush with which you can change its style and the color of the different lines that appear on it.
And that’s it, once you have everything to your liking you will have completed your first basic chart in Excel. The process that we have described to you is practically the same for the different types of graphics, although it will increase in complexity the moment you decide to do them based on other more advanced data.
Also Read: iTunes for PC: Download free iTunes for Windows 10
